
That not enough to satisfy you? Head on over to the Internet Statistics Database while you’re here – it’s also packed full of interesting stats.
50% of UK high street brands are failing to offer sustainable alternative to paper receipts
Despite recent headlines relating to sustainability, brought on by David Attenborough’s most recent documentary, new research from Mailjet has found that 15 of the UK’s top 30 high street brands are failing to offer e-receipts.
This is also despite the fact that, in the UK, around 11.2 billion receipts are printed each year, at a cost of at least £32 million. It appears that half of UK high street brands and retailers are still reliant on physical receipts for every purchase, with just 50% offering alternatives to paper receipts.
The study found that Uniqlo, Dorothy Perkins, and Evans are the best in class when it comes to encouraging more sustainable consumer behaviour, with proactive promotion of e-receipts via signs or tablets in-store. In all other cases, e-receipts were only sent after the survey testers specifically made the request.

What are fashion retailers doing to combat environmental costs?
Abandonment rate for airline booking sites is higher than the travel average
A new report by SaleCycle has revealed that the global abandonment rate for airline booking sites is higher compared to both the travel sector and the overall online average.
The average global abandonment rate for airline sites is currently 87.9%, compared to 81% for the travel industry, and 76.9% for average overall online abandonment.
The report also states that abandonment rates are lower in the months between September and December. This also happens to be the period with the lowest sales volume, which shows that visitors reaching airline websites have a greater intent to purchase, with fewer visitors only researching for future holidays.
In terms of the travel booking funnel, almost 46% of users view a travel product (meaning they have searched and viewed a hotel room or flight), after which 17.6% actually begin the booking process. This is relatively high when compared to retail, where 11.5% of shoppers add an item to their shopping carts on fashion ecommerce sites, and 3.7% go on to make a purchase.

Global sports sponsorship to reach £35bn in 2019
New research from Two Circles has found that business spending on sports sponsorship is set to grow by 4% to reach £35bn globally in 2019.
Financial services already leads the way when it come to sports sponsorship, accounting for 19% of deals. This is followed by automotive, airlines, gambling, and alcohol, accounting for 14%, 13%, 12%, and 9% respectively.
Two Circles also predicts that spend on sponsorship will increase by 6% on average year-on-year from 2020, hitting £48bn by 2024. The research suggests, however, that brands are not yet doing enough to utilise digital marketing.
Speaking to the BBC, Two Circles commented: “By embracing the power of digital and data to create sponsorship assets that better satisfy the objectives of brands, rights-holders will realise the true value of their sponsorship businesses.”
Online retailers failing to capitalise on social sharing
A new report from Visualsoft has revealed that almost a fifth of leading UK ecommerce sites are failing to connect with their customers’ extended social circles.
From the analysis of 250 of the UK’s leading brands across a range of sectors, it found that 17% have neglected to add clear social sharing options for their customers’ purchases – a 4% decline year-on-year.
This is particularly concerning given that the average number of ecommerce social media followers has grown exponentially over the last 12 months, even doubling for networks such as Twitter, YouTube, and Pinterest.

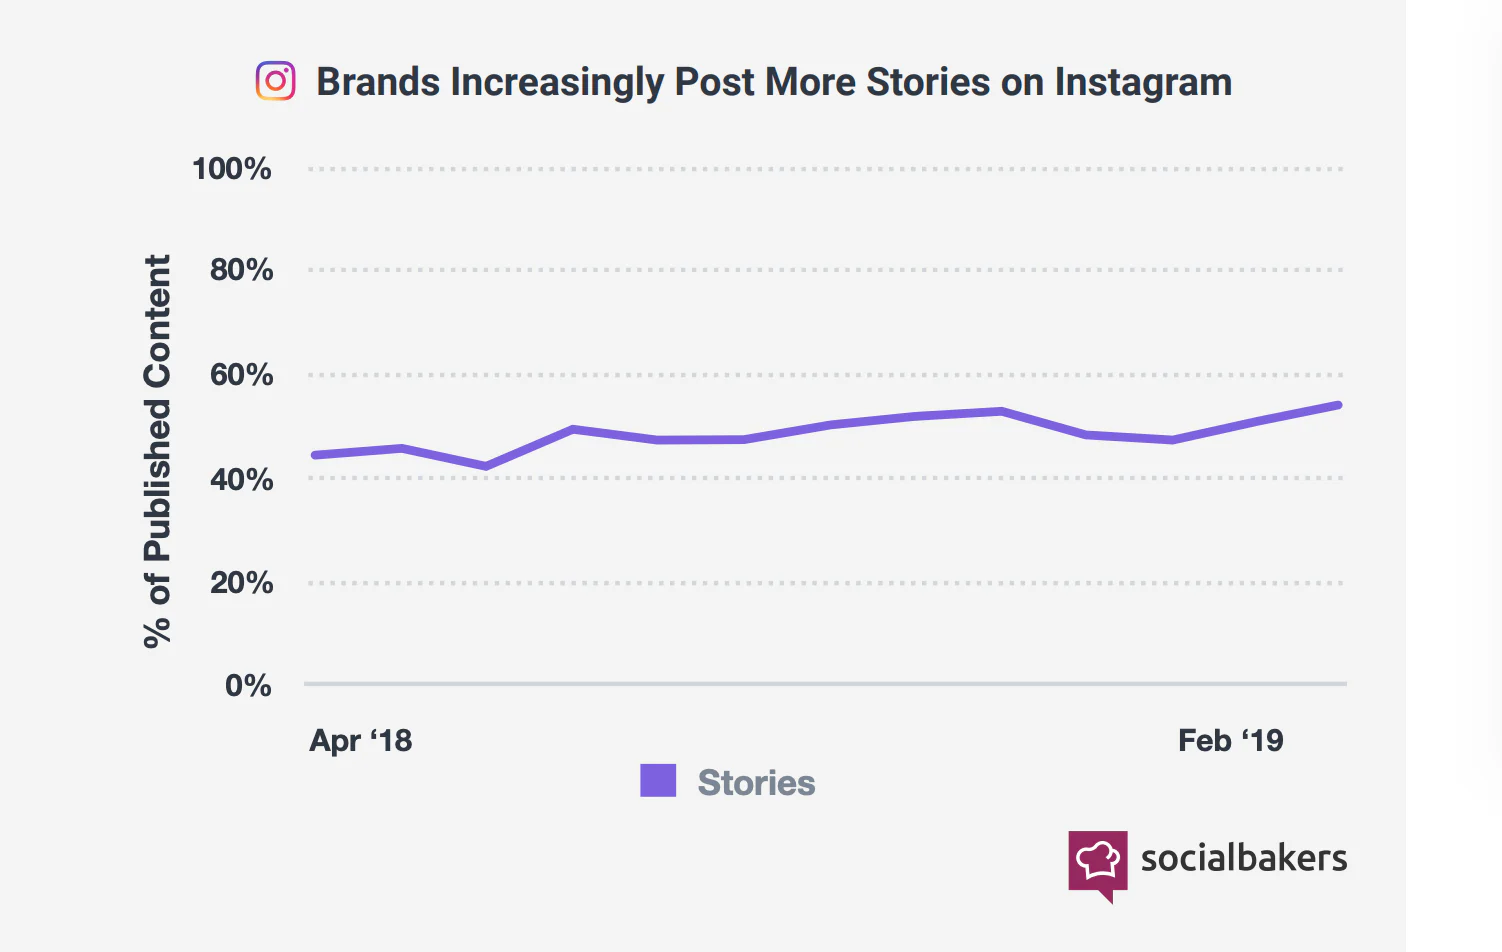
Usage of Instagram Stories has grown 21% since March 2018
A new report by Socialbakers delves into how brands are taking advantage of influencer marketing (and related social media platforms).
Key takeaways from the report include: Instagram Stories remains an invaluable source of engagement for brands, with the format usage growing by 21% since March 2018. Images remain the top content format preferred by influencers, however, the gap between the formats is closing. In January 2017, images accounted for 91% of influencer content.
Fast forward to 2019 Q1, however, and images made up 71%, videos 10%, and carousel posts 18% of all influencer content.
Lastly, transparency within influencer marketing is on the increase, with the number of influencers using the #ad hashtag on Instagram increasing by an impressive 133% in 2018. Read more analysis based on Socialbakers’ report here.
Five content tips for great Instagram and Facebook stories
Advertisers plan to spend an average of $18m on digital video ads in 2019
A new report by the IAB states that brand spend on digital video ads is on the up, with advertisers reporting that they expect to spend an average of $18M in 2019— nearly a 25% increase from last year.
Video ad spend has grown across all verticals since 2018, with media & entertainment brands leading the way with a 75% increase year-on-year. This is followed by fashion and apparel brands, which increased spend by 45%.
Nearly two-thirds of digital budgets will be allocated to video this year, evenly split between desktop and video formats. More than a fifth (22%) of this digital video spend will go to social media, with 18% going to online TV shows.

Comments