- Domain Trust – defined by Majestic
- Number of referring domains
- HTTPS vs HTTP
- Mobile-friendly score
- Internal links prioritisation
- Canonical tags
- Keyword in meta title, h1 and h2 tags
- Length of on-page content for ranking pages
- Brand + product term to define relevance for a brand and the product searched for
- Engagement – average time on site and bounce rate as defined by Alexa.com
- Engagement of landing pages
The process: I have collated 100 keywords from five of the most popular online industries to identify which are the best performing websites. Remember, this is only 100 keywords and they are often much broader than this.
Once I have identified the top performing websites and have seen what is working at industry level, I am going to dive into the most popular keyword in the industry and run a SERP comparison to identify what splits websites apart in the top 10. Then, in conclusion, we’ll be able to provide some insight as to what you should be focusing on to perform well in your industry.
So, to begin…
Insurance
In the insurance sector, if you were to rank in first place for 100 keywords then the maximum traffic would equal 613,874 clicks.
This market is now dominated by aggregators due to the nature of people’s searches for insurance related products. Brand loyalty is slowly dwindling within this space, even with brand loyalty being very much at the top of insurance providers’ remarketing. People are after the best price, period.
Following a Google Insights report in April 2015 it was concluded that 61% of people perform research before a vehicle insurance purchase, and I think it is fair to roughly extrapolate that across the insurance market as a whole. The report found that only 44% of people bought from the brand they considered initially, but I think this is very apparent in the UK and would be a smaller percentage compared to France where this research was conducted. This helps explain the aggregator dominance and low brand advocacy.
The chart below shows how the market looks for this keyword set. To explain the axis:
- X = number of ranking keywords
- Y = estimated monthly clicks

A large part of our work when looking at individual markets is to categorise each keyword into a product or offering group. This allows us to then dig into the individual sub-categories and begin to go very granular.
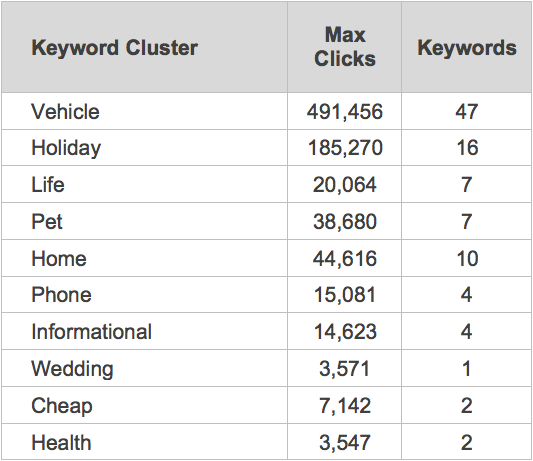
Below shows how the 100 keyword set splits into individual categories, the largest clearly being vehicle insurance.

After segmenting the market into different categories, we’re able to see that vehicle insurance provides the largest return into overall number of clicks. Vehicle is closely followed by holiday, then home, pet, life and so on.
The online insurance market is one of the most hotly contested, and the difference between position one and two for key terms could be worth millions of pounds of revenue. Looking at overall authority within the market share, it’s interesting to see that eight out of the 10 websites have an overall authority above 50.

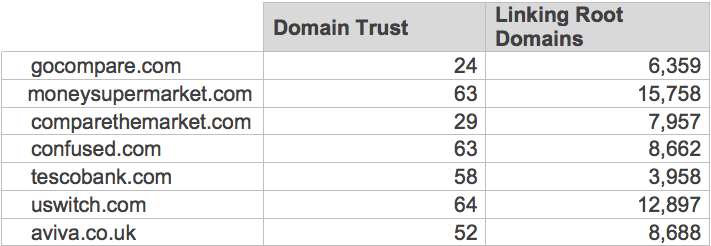
What is really refreshing in this chart is the fact that GoCompare.com does not have the most referring domains, nor the most authoritative domain, yet it leads the insurance market. It is fantastic news; this SERP is clearly showing a move away from link-based ranking metrics – to an extent.
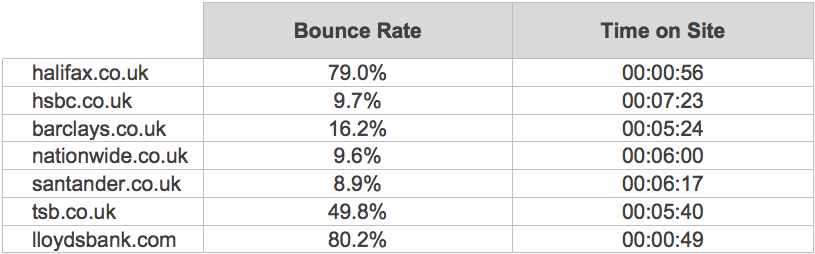
GoCompare.com does lead the engagement metrics chart, with an average time on site of 7mins and 26secs and bounce rate of 39.3%. Its average time on site is 30% higher than that of the nearest competitor.

A standout in this graph must be Tesco Bank with a bounce rate of just 15.2%. This is incredible.

‘Car insurance’ is the most popular search term within the insurance market, at 550,000 searches per month on average in the UK. Let’s analyse the top 10 websites and how they compare.

We identified that as part of the overall market analysis, link authority and number of links were not the deciding factors. It does not appear that HTTPS, page speed, internal links or words on the page are deciding factors either. Interestingly, we’re seeing in this SERP that both engagement and brand relevancy to the product are far superior.
Looking at the final column in the table above, GoCompare is far more relevant for car insurance than any other brand in the top 10. That even includes Admiral, which is specifically a car insurance brand.
The search term ‘gocompare car insurance’ has 110,000 searches on average per month. How much of that is influenced by the term ‘gocompare’ and ‘go compare’ can’t be accounted for, but this, mixed with great engagement, is certainly at play in this SERP.
Mortgages
In this sector the maximum amount of traffic from ranking first for the 100 keywords is 264,332 clicks.
This market is now dominated by mortgage lenders as you would expect. Halifax has been slowly growing its online presence over the last year, so it will be interesting to see where it is overly proficient.
After using the same methodology as the previous analysis, we’re able to start digging into the data. Halifax.co.uk is by far the market leader in the mortgages space. It receives an estimated 79,734 more visits than HSBC, the second largest. Halifax receives an estimated 59% of all position one clicks within the keyword set we collated.

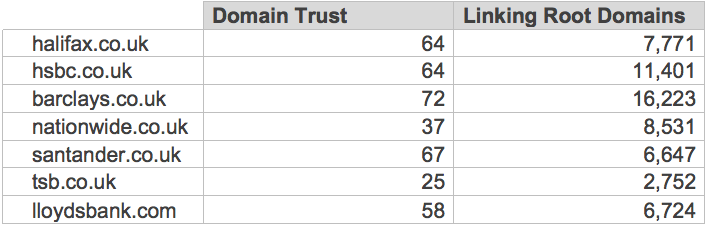
When looking at authority and number of links within this space, we can see that Halifax is outperformed by Barclays with an overall authority of 72 and referring domains total of 16,223. This again puts a solid argument together that links aren’t the number one ranking signal within this space.
There are some surprises in the authority sphere with Nationwide only having an overall authority of 37 and TSB at 25.

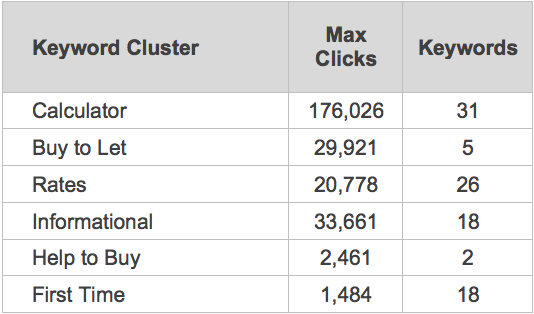
The ‘calculator’ section of the keyword set has by far the most search volume and estimated clicks associated to it. With 176,026 estimated clicks and 31 keywords, it contributes an enormous amount to the overall market within mortgages.

Due to Halifax having the largest market share by far, I wanted to identify the reason for this domination. It appears that the answer is Halifax’s first position ranking for ‘mortgage calculator’. Ranking first for this keyword has led to the brand reaching an estimated 145,654 clicks and 82.7% market share.
This traffic will prove invaluable for a brand that also sells mortgages; it is the best lead generation tool out there for both providing invaluable information and qualifying leads/mortgages that you want to follow up.
Below is the split of estimated traffic that Halifax captures:
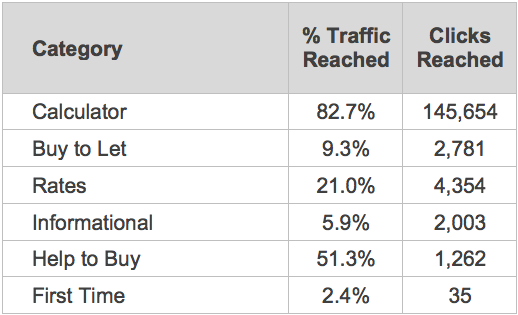
It is clear to see that it nearly owns the entirety of the calculator space. However, there are significant gaps in informational content that could also add to Halifax’s purchase funnel. For example, Halifax should provide expert content on the processes for buy-to-let, help-to-buy and first-time-buyer guides. Doing this will eliminate the risk of having all its eggs in one basket with ‘mortgage calculator’ while providing expert content from a lender, which people reading up on the subject will trust.
It currently does this very poorly, but high street lenders such as Nationwide and Natwest do it very well. Having the content very close to the mortgages section has allowed it to rank very well for terms such as ‘first time buyers guide’ etc. This is something Halifax should action sooner rather than later.
Having this position one ranking, however, has damaged Halifax’s engagement metrics. The bounce rate for Halifax is 79% and average time on site at a dismal 56 seconds.

After looking at the experience of Halifax’s mortgage calculator, which is cannibalising the average time on site and bounce rate, it becomes slightly clearer why this may be the case.
The mortgage summary on the right-hand side automatically populates and does not offer a cross link into Halifax’s mortgage offering. A simple cross link may help keep users on the website once they have discovered out how much they can borrow. Also, the online banking portal which most visitors will be going towards goes onto a separate domain – halifax-online.co.uk
Consolidating this into Halifax.co.uk may further help in areas of which Halifax is unaware, at present. Improving these engagement metrics could help improve rankings across the board.

‘Mortgage calculator’ is the most popular search term within the insurance market at 550,000 searches per month on average in the UK. Let’s analyse the top 10 websites and see how they fare against one another.

It’s clear to see that authority and links are not the main ranking factors when it comes to mortgages. Neither are HTTPS, page speed or number of words on the page.
Halifax is one of the largest mortgage lenders in the UK and, like insurance, its brand relevancy for mortgages and in particular the mortgage calculator surpasses its rivals. With a brand plus keyword search volume total of 27,100, it’s 4,900 higher than the BBC which has an absolutely archaic page for its mortgage calculator that is not mobile-friendly and does not have a self-referring canonical tag.
If this BBC page was updated, I would have it as a close contender to Halifax for this key term.

Jewellery
In the jewellery sector, if you were to rank in first place for 100 keywords then the maximum traffic would equal 370,564 clicks. This market is now dominated by bricks and mortar stores as you would expect.
However, there was an anomaly present within the data and that was Stevenstone.co.uk. Stevenstone ranks first for ‘engagement rings’, but after the analysis was run I concluded that it was wrongly ranking for this term, and did not want to skew the data or arrive at wrongful conclusions.

H Samuel leads the market that is largely dominated by brands on the high street. This is a much more closely contested market than others analysed so far, with the difference in market leader being only 3.9% market share and 25,548 estimated clicks.
I believe this is down to H Samuel’s breadth in product and keyword ranking. H Samuel ranks for 97% of the keyword set (97 keywords), whereas the next is Ernest Jones with 71 keywords. With a slightly different keyword set this could be a different outcome, but for this exercise, H Samuel leads the way.

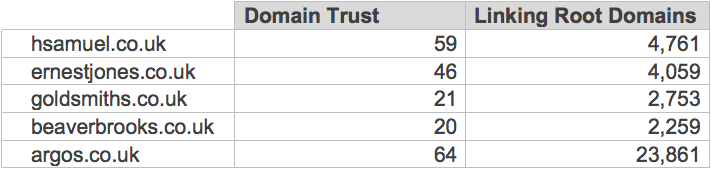
At first glance, authority and number of referring domains for each website do not stand out as a definitive ranking signal.
Argos has far superior authority and number of domains but it is not jewellery-specific. But from the jewellery-specific websites, H Samuel is further ahead in regards to both.


Engagement is a similar story. Argos performs better than the rest; however H Samuel does so in regards to the jewellers. The average time on site for H Samuel is just under a minute higher than the others, a clear sign of product breadth and website quality as the bounce rate remains low.

Engagement rings is the most popular search term (behind branded Apple watch term at 301,000 searches) within the jewellery market at 201,000 searches per month on average in the UK. Ranking first for this alone can draw in an estimated 48,501 clicks each month.
Let’s analyse the top 10 websites and how they fare against one another.

Ignoring Stevenstone, we can see that H Samuel does not have the largest number of links, nor the strongest authority. There is no HTTPS, it ranks as mediocre in page speed, there is no self-referring canonical and it has a low level of internal links.
However, it does have the second highest number of brand plus keyword searches, again proving brand relevancy is playing a factor. We also know of H Samuel as a high street retailer with huge jewellery relevancy, but we cannot place a signal on this.
One thing I did notice is that since the launch of the new website Google is struggling with the ranking page as ‘/diamonds’ is ranking but it has set up a canonical to http://www.hsamuel.co.uk/webstore/engagement.cdo
Fixing this relevancy issue may help H Samuel overcome the dark horse, Stevenstone.
Fashion
In the fashion sector, if you were to rank in first place for our 100 keywords then the maximum traffic would equal 1,220,592 clicks.
This market is by far the largest in this comparison data set. It is dominated by ASOS but significant market share is being taken away by the likes of Boohoo, Missguided and House of Fraser. This keyword set focused across both male (M) and female (W) keywords and if it was to be gender-specific, particular brands would be more prominent over one another.

Looking at this broad, generic keyword set, we can see that ASOS reigns supreme. However, significant market share is beginning to be taken away by brands such as:
- Boohoo
- Missguided
- Prettylittlething
- Zalando
The first three are really rising and progressing with their marketing activities, whilst Zalando is the ASOS of Europe which has come to the UK with a bang. Since launching its site with great SEO optimisation, Zalando has gone from strength-to-strength.
ASOS currently captures an estimated 586,719 clicks per month with 48.1% overall market share. ASOS has so many pages ranking for these keywords that the company ranks for 106.1% of the keywords, meaning it double, triple, and quadruples up on ranking URLs for some keywords.
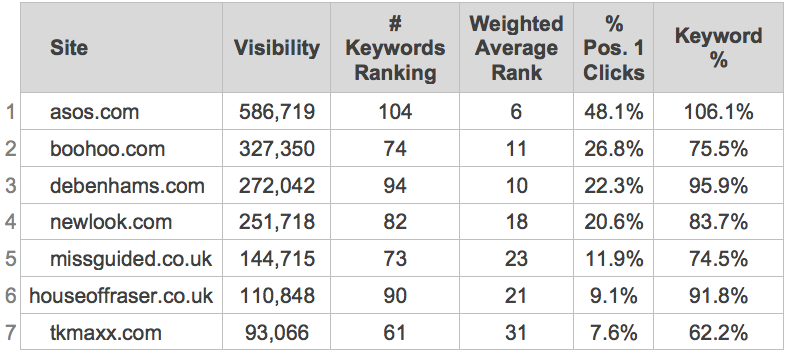
Boohoo is second in the market with 327,350 estimated clicks and 26.8% of the market, but only ranks for 75.5% of the keyword set. This suggests the number could be much higher if it ranked for the other 24.5% of the keyword set.
When looking at the authority and number of referring domains that go into each of the websites, ASOS leads the market. ASOS has more than three times the number of links of competitors, which is more than contributing to its overall authority of 75. This is the first time I’ve seen this in the analysis so far.

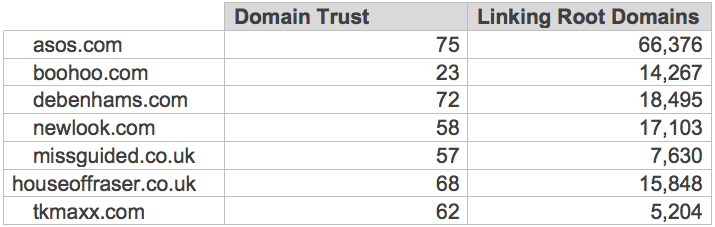
ASOS excels yet again in engagement; 27% bounce rate with an average time on site of over 10 minutes – that’s some serious browsing and adding-items-to-basket time!


After categorising the keyword data, which I split into both men’s and women’s, there was a clear winner for where the most estimated clicks lay; dresses. Due to the vast amount of categories that online fashion retailers have, the chart below represents a shrunken-down number of categories to those that have the most potential.

Dresses is the most popular search term within the fashion market at 201,000 searches per month on average in the UK. It was jointly most popular with prom dresses, which also receives 201,000 searches on average per month. Due to that being an average, which will have a huge seasonal spike when proms happen, let’s analyse the top 10 websites and how they fare against one another.

After all the market domination by ASOS, it is outperformed by five other brands in this SERP.
The top websites have a very similar structure on-page with hyperlinks and internal links pointing you to the other types of dresses, which I find very useful. The one thing that the top websites do have that ASOS doesn’t and the data doesn’t show, is that they are mainly female-specific websites, which may establish a stronger relevancy towards dresses.
Prettylittlething purely stocks female clothing and has had a huge push with marketing recently. Boohoo has only just recently launched a male range, Missguided is female only, New Look has a limited male stock, Monsoon is female only – and then you have ASOS.
Again, we can’t draw any strong conclusions but it’s interesting to theorise. Perhaps on this occasion ASOS’s breadth of product and parameter/ugly URL has let it down.
Travel
In the travel sector, if you were to rank in first place for our 100 keywords then the maximum traffic would equal 504,247 clicks.
The market leader in this space is onthebeach.co.uk with 178,478 estimated clicks and 35.4% market share for the keyword set I collated. Being market leader with only 58% keyword coverage suggests it ranks particularly well for some generic terms.
Closely following OnTheBeach are Last Minute and Skyscanner.

OnTheBeach has really low overall authority and number of referring domains, showing once again that this is not an important ranking factor within this niche.

It is significantly outperformed by brands such as Lastminute, Skyscanner, Thomson and EasyJet.

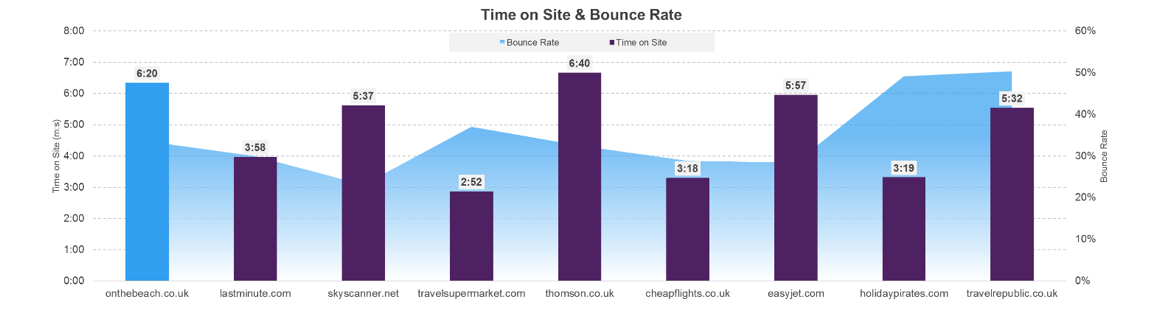
OnTheBeach has the second highest average time on site at 6mins 20secs with a much smaller product offering than Thomson. All holiday sites within this analysis have good bounce rates, but this may be more down to the nature of the market rather than poor experience.
When searching for holidays, we are very patient people. We like to explore what is available to us on each different website to ensure we’re not missing an offer or resort.
Due to the rise in mobile, the dwell time is much larger, as people are in the research phase.

Cheap holidays is the most popular search term within the holiday market at 550,000 searches per month on average in the UK. Let’s analyse the top 10 websites and how they fare against one another.
OnTheBeach has the market majority, but Thomson in this case leads on the most searched-for term. When analysing what it excels in, it does not have the largest number of referring domains, authority, internal links or number of words on the page.
However, it does lead the market in regards to relevancy with the highest number of searches for ‘brand plus keyword’; in this case being ‘thomson cheap holidays’ with 390 searches on average per month.

In conclusion…
Below are the five brands and URLs that capture the UK’s most competitive search terms in their relevant niche:

Below are some averages and key takeaways that this analysis has provided me with:
- Authority is not the most important signal – average trust = 40.2
- Number of referring domains is not the most important signal – average linking root domains of 9,171 per domain.
- HTTPS is not a definitive ranking signal to push those out of the top positions if they remain on HTTP. I was a firm believer in this and from communication Google has produced, I believe I’m not the only one. However, these websites that remain on HTTP and lead the most competitive SERPs may still excel in other areas that make this small HTTPS ranking signal obsolete. But after looking at this analysis HTTP > HTTPS.
- You must be mobile-friendly. After running each ranking URL through the test, they were all mobile-friendly. Just being mobile-friendly isn’t enough now, each brand is pushing the limits with ensuring their website is the best mobile site, especially with the looming mobile-first index. The BBC mortgage calculator page is a great example of a page that has to be made mobile-friendly.
- Page speed is important, but not a deal breaker unless painfully slow.
- Average internal links was seven per URL, which isn’t impressive or advisable. I’d strongly recommend that it should be above this.
- Self-referring canonical on the URLs is a must.
- Keywords in meta title and following header tags is a must: I did not come across one URL that didn’t follow this practice.
- On-page content is important, as is faceted navigation. Average word count on page is 471 and the fashion websites were one to follow from an internal linking perspective at category level.
The stand out factor for me throughout this entire piece was the weight that seemed to be conveniently placed on average ‘brand plus keyword’ search volume. Three out of the five market leaders had weaker metrics across the board, bar this – in which they were the best performers. The average brand plus keyword search volume is 38,478.
This shows to me that sometimes you may excel in every ranking signal, but if your brand is not relevant to the product in the customer’s eyes then it isn’t in Google’s. This shows the importance of building brands and not placing sole digital marketing strategies on link and authority acquisition.
To learn more on this topic, check out these resources:
Comments