
I’ve written a lot about content strategy over the past decade. I’ve also highlighted various niche tactics that can help content creators to succeed, as well as plenty of examples of excellent content. But I haven’t created many visualisations, and recently I have been keen to do one.
Surprisingly, nobody has yet created a periodic table for content marketing, so I thought I’d have a go.
Before I introduce it, allow me to doff my hat at Dmitri Mendeleev, who first published the periodic table of elements. I’ll also nod in the direction of Danny Sullivan, who created one based around SEO success factors.
Let me also say that I hope that this is helpful, as the world is awash with dubious infographics and I really didn’t want to produce something just for the sake of it.
The usual caveats apply: there will be obvious omissions, possibly duplicated symbols, and other schoolboy errors. I shall fix these things in a future iteration, so please raise a flag if you spot anything.
Ok then, let’s take a look at the table, and I’ll explain my thinking along the way…
How to use the Periodic Table of Content Marketing
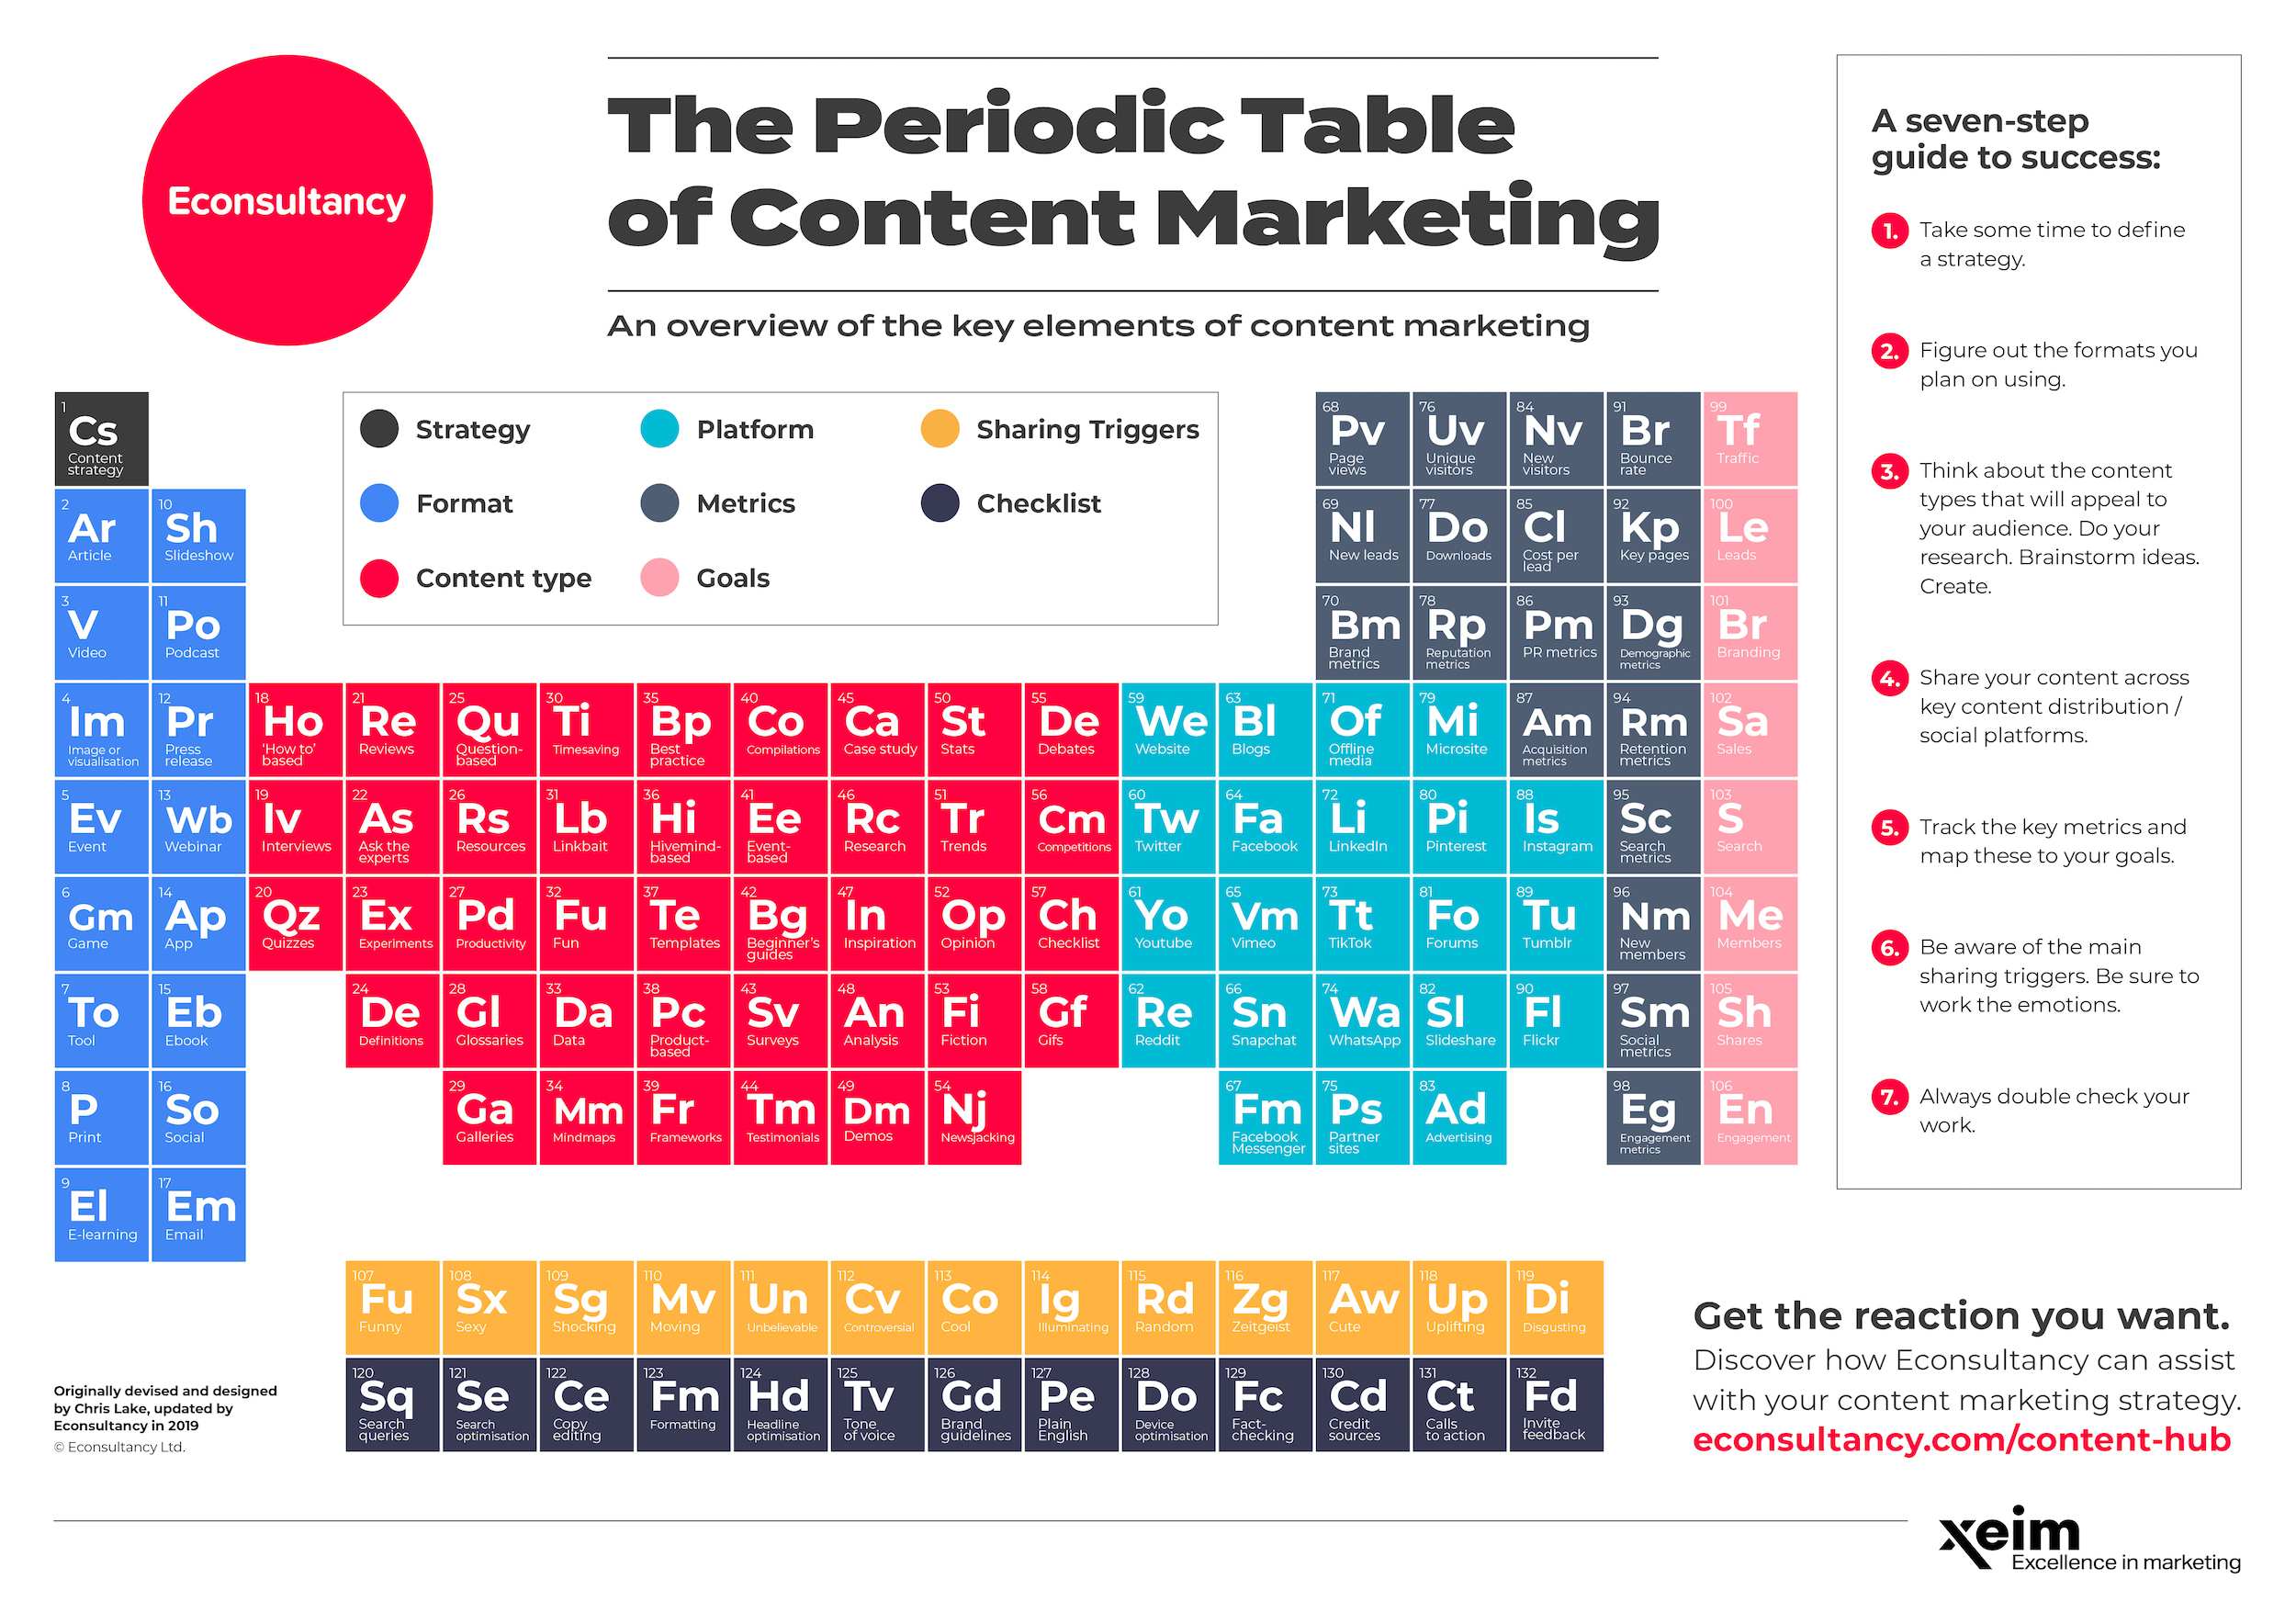
If you click the image a large screenshot should appear. I hope it is all reasonably self-explanatory. There are eight areas that I have focused on, as follows:
Strategy
The fundamental key to success. Planning and focus is essential. You need a clear strategy, mapped to your long-term business goals. If you don’t have one and need some outside guidance then we can help. We also have a very useful best practice guide on content strategy.
Format
Content comes in many different shapes and sizes. Note that you can use multiple formats for a single piece of content. Slice and dice! Right now, I’m writing a blog post to support a visualisation. Maybe I’ll produce a video or slideshow too.
Content Type
These are based on the common types of content that work well for our business. Many of them will work well for your brand too. Sometimes you’ll use multiple content types for a single piece of content. You could file this periodic table under a few different types.
Platform
These are content distribution platforms. You might own some of these (e.g. #59, your website). Others are social sites (your own, your network, third parties). All of these help spread the word about your content.
Metrics
These help you to measure the performance of your content. For the purposes of brevity, I have largely grouped these metrics together (e.g. ‘acquisition metrics’).
Goals
All content should support your primary business goals, whether that’s to generate lots of traffic, or to sell more, or to increase brand awareness. Laser-guided content will tick a few of these boxes.
Sharing Triggers
This is largely inspired by Unruly Media’s triggers for sharing content. Think about the emotional drivers behind sharing, and make sure the content you create makes people feel something.
Checklist
I will probably edit this post at least 10 times after publishing it, and no doubt the periodic table will need a tweak here or there. Errors need to be fixed, and all content should be properly optimised (for search, for social, and to support your business goals). Be diligent!
A few footnotes…
- I have largely numbered the table vertically, rather than horizontally, as it makes more sense to me to do it that way.
- There may be a little duplication here and there. Forgive me.
- I haven’t included everything. There may be things missing that are valuable for your business, so by all means add them (I’ve left a little space here and there).
- Some elements could live in multiple categories.
Anyway, I hope this is useful. Please leave your comments below or nudge me on Twitter to let me know what I’ve missed, or if there are any errors.
Comments